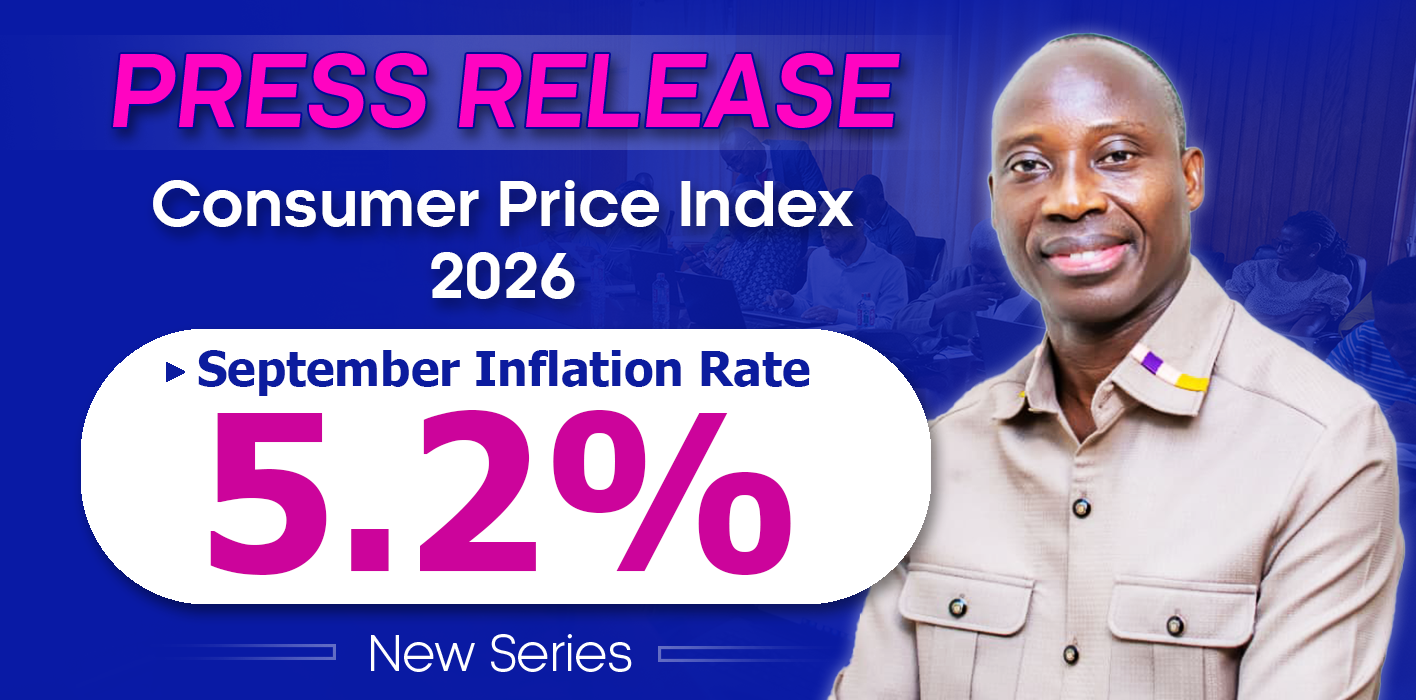
Official Ghana Statistical Service CPI graphic for September 2026; headline inflation was 5.2%.
MyGHPages Business Desk | 29 October 2026
Ghana’s annual consumer inflation rose to 5.2% in September 2026 from 5.0% in August, according to the Ghana Statistical Service (GSS). The increase was modest in percentage-point terms, but the headline rate does not tell every household what its own monthly expenses will look like. Rent, transport, school costs, food choices and location can all shape the experience of price changes.
GSS data reported by the Ghana News Agency on 8 October showed that consumer prices rose 1.1% between August and September. The annual rate remained 4.2 percentage points below September 2025’s 9.4%, but the slight rise from August signalled that some price pressures were still present. Understanding the detail is more useful than treating 5.2% as a universal increase in every price.
What the 5.2% figure actually means
Annual inflation compares the overall consumer price index with the same month a year earlier. It does not mean that every item became 5.2% more expensive, nor does it mean that prices fell because inflation is lower than it was last year. If a price index continues to rise more slowly, prices can still be higher than before; the rate of increase has simply changed.
For September, the CPI stood at 271.5 compared with 258.0 in September 2025, according to the GSS figures reported by GNA. The month-on-month increase of 1.1% is a separate measure from the year-on-year rate. Readers should keep those measures distinct when comparing news reports or making a household budget.
Food and non-food prices are moving differently
Food inflation increased to 4.0% in September from 3.0% in August. Non-food inflation eased from 6.8% to 6.2%, but remained higher than the food rate. The categories can move in different directions because they contain many products and services with different supply chains, costs and seasonal patterns.
Individual foods also showed sharp differences. GSS figures reported by GNA highlighted year-on-year increases for fresh tomatoes, ginger and shrimps, while some other items—including lime, maize and Bambara beans—recorded price declines. A national average can therefore hide the fact that a family buying a lot of one item may experience a different change from a family whose diet and shopping locations are different.
Households can respond by tracking the items they actually buy rather than assuming the national inflation rate applies equally to their shopping basket. Keeping a simple weekly record of staple foods, transport fares, rent and utilities can help reveal which expenses are changing. It can also help families compare prices without sacrificing nutrition or buying goods that are unsuitable just because they appear cheaper.
Why services and rent deserve attention
Services inflation was reported at 8.3%, compared with 4.2% for goods. This difference matters because many households spend a substantial part of their income on services such as housing-related costs, transport, school fees, repairs and personal services. Even when the overall inflation rate is moderate, an increase in a large recurring bill can put pressure on a monthly budget.
Rent is especially important because it is often a large expense that cannot be adjusted easily from week to week. Tenants should read their agreements carefully, keep records of payments and understand the terms governing renewal or any proposed change. They should not assume that a national inflation figure automatically changes the rent specified in a contract. If there is a dispute, the written agreement and applicable tenancy rules matter more than a general CPI headline.
For transport, utilities and school expenses, households may benefit from planning ahead for predictable payments, checking whether there are lower-cost but safe options and setting aside a small reserve for irregular expenses. The goal is not to cut every cost indiscriminately; it is to identify which expenses are essential, which can be compared and which can be scheduled more efficiently.
Regional differences can change the household experience
The GSS release also showed substantial regional differences. GNA reported that Ashanti recorded the highest regional inflation rate at 9.8%, while the Western Region recorded -0.5%. Those figures do not mean every item in Ashanti rose by 9.8% or every item in the Western Region became cheaper. They describe the movement in the regional basket measured by the index.
Regional variation can reflect differences in the items purchased, local market conditions, distribution costs, housing and service prices. A household should therefore use the national rate as an important indicator, but still track its own local prices. This is particularly useful for small businesses that set prices in one town while buying stock or services from another region.
What households and small businesses can do
A practical first step is to separate essential expenses from flexible spending. Housing, food, transport, utilities, health and education usually require priority, while some discretionary purchases can be planned around sales or delayed if necessary. A written budget makes trade-offs visible and helps prevent small, frequent expenses from quietly consuming money needed for larger bills.
Second, compare like-for-like prices. A lower unit price may reflect a smaller package, a different grade or an added transport cost. For food, compare price, quantity, freshness and expected waste. For household goods, consider durability and repair costs rather than choosing only by the initial amount paid.
Third, avoid making financial decisions from one month’s inflation reading alone. Inflation data can inform decisions, but households should also consider their income stability, debt repayments, emergency savings and upcoming obligations. Businesses can use the official CPI and their own supplier invoices to review pricing and cash flow, while clearly distinguishing consumer inflation from the cost changes affecting their particular operations.
Fourth, keep a record. A simple notebook or spreadsheet showing the date, item, quantity and price can help identify trends over several weeks. For a small shop, records of purchase prices and sales margins can show whether a price increase is caused by suppliers, transport, spoilage or another factor. Better records also make it easier to explain price changes to customers.
What the figures do—and do not—tell policymakers
The September data provide evidence that inflation was still far below the rate recorded a year earlier, while some domestic and service-related pressures remained. That combination creates a policy challenge: progress in lowering overall inflation can coexist with difficult price movements in specific categories. Policy responses need to account for supply conditions, productivity, transport and distribution, housing, and the way services are priced.
For consumers, the most useful public information is a regular, accessible breakdown of headline inflation, food and non-food movements, services, regions and selected items. The GSS publishes CPI information and supporting materials on its official website. Readers should use that primary source when checking a figure shared in social media posts or a headline that does not clearly state the period measured.
What to watch in the next release
The next update will show whether the rise from August to September continues, reverses or stabilises. Households can watch the direction of food, services and housing-related inflation, but should avoid assuming in advance what the next rate will be. A single monthly movement is not enough to establish a long-term trend.
In the meantime, the strongest response is a combination of reliable information and practical planning. A 5.2% annual rate is useful context, but household decisions work best when they reflect actual income, local prices, contract obligations and spending patterns.
Frequently Asked Questions
What was Ghana’s inflation rate in September 2026?
Ghana’s year-on-year headline inflation was 5.2% in September 2026, up from 5.0% in August, according to the Ghana Statistical Service.
Does 5.2% inflation mean every price rose by 5.2%?
No. It is an average measure across a basket of goods and services. Individual items and regions can rise faster, rise more slowly or fall in price.
Why can rent and service bills still feel expensive?
Services inflation was reported at 8.3%, higher than the 4.2% rate for goods. A large recurring bill can strain a household budget even when the headline rate is much lower than a year earlier.
Where can readers verify Ghana’s official inflation data?
Use the Ghana Statistical Service’s official inflation page and CPI release materials. News reports are useful for context, but the GSS is the primary statistical source.
Sources: Ghana Statistical Service — Inflation Rate; Ghana News Agency, 8 October 2026; Bank of Ghana CPI archive.
For more Ghana business and education updates, visit MyGHPages.